2010 UK local government election
Elections to Stevenage Council were held on 6 May 2010. One third of the council stood for election; the seats which were last contested in 2006 . The election saw the Conservative Party gain a further 3 seats.
After the election, the composition of the council was:[1]
Labour 27 Conservative 9 Liberal Democrat 3 Election result Stevenage Local Election Result 2010 Party Seats Gains Losses Net gain/loss Seats % Votes % Votes +/− Labour 8 0 3 -3 61.5 35.9 13730 -4.2% Conservative 4 3 0 3 30.8 34.9 13365 -0.5% Liberal Democrats 1 0 0 0 7.7 21.9 8367 +5.1% UKIP 0 0 0 0 0 6.3 2402 +2.2% BNP 0 0 0 0 0 0.4 136 +0.4% English Democrat 0 0 0 0 0 0.3 133 -2.2% Independent 0 0 0 0 0 0.3 121 +0.3%
Ward results Bandley Hill Location of Bandley Hill ward Bandley Hill Party Candidate Votes % ±% Labour Joan Lloyd 1,149 38.6 -3.1 Conservative Roger Gill 1,055 35.5 +5.3 Liberal Democrats Barbara Segadelli 497 16.7 +7.2 UKIP Angela Denness 275 9.2 +9.2 Majority 94 3.1 -8.4 Turnout 2976 61.5 +27.6 Labour hold Swing
Bedwell Location of Bedwell ward Bedwell Party Candidate Votes % ±% Labour Brian Underwood 1,114 39.8 -12.8 Conservative Christine Saint Leitner 744 26.6 -4.6 Liberal Democrats Leonard Lambert 522 18.6 +2.4 UKIP Maureen Dilley 421 15.0 +15.0 Majority 370 13.2 -8.2 Turnout 2801 60.0 +28.0 Labour hold Swing
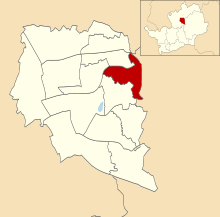
Chells Location of Chells ward Chells Party Candidate Votes % ±% Labour Pamela Stuart 1,226 39.1 -4.7 Conservative Matthew Wyatt 973 31.0 +4.6 Liberal Democrats Gareth Steiner 937 29.9 +0.1 Majority 253 8.1 -5.9 Turnout 3136 65.2 +27.2 Labour hold Swing
Longmeadow Location of Longmeadow ward Longmeadow Party Candidate Votes % ±% Conservative Christine Hurst 1,086 37.5 -2.9 Labour Suzanne Myson 996 34.4 -3.2 Liberal Democrats Ralph Baskerville 561 19.4 +7.7 UKIP Roy Worden 254 8.8 -1.6 Majority 90 3.1 +0.3 Turnout 2897 67.2 +27.7 Conservative gain from Labour Swing
Manor Location of Manor ward Manor Party Candidate Votes % ±% Liberal Democrats John Mead 1,427 40.9 +0.1 Conservative Susan Smith 1,144 32.8 +1.9 Labour Joseph Sherry 711 20.4 -2.8 UKIP Mark Rowe 210 6.0 +0.9 Majority 283 8.1 -1.8 Turnout 3492 71.0 +29.7 Liberal Democrats hold Swing
Martins Wood Location of Martins Wood ward Martins Wood Party Candidate Votes % ±% Conservative Michael Hearn 1,044 36.6 -1.0 Labour Jeanette Thomas 921 32.1 -3.2 Liberal Democrats Kevin Aylward 535 18.6 +11.5 UKIP Pat Jones 239 8.3 +5.8 English Democrat John Cooper 133 4.6 -8.7 Majority 123 4.5 +2.2 Turnout 2872 62.3 +26.4 Conservative gain from Labour Swing
Old Town Location of Old Town ward Old Town Party Candidate Votes % ±% Conservative Marilyn Yarnold-Foster 1,421 38.7 -3.4 Labour Pamela Gallagher 1,349 36.7 -4.2 Liberal Democrats Matthew Snell 662 18.0 +8.8 UKIP Bernard Maddox 244 6.6 -1.2 Majority 72 2.0 +0.8 Turnout 3676 66.1 +24.9 Conservative gain from Labour Swing
Pin Green Location of Pin Green ward Pin Green Party Candidate Votes % ±% Labour Lin Martin-Haugh 1,163 40.9 -6.7 Conservative Philip Roethenbaugh 881 31.0 +1.5 Liberal Democrats Scott Copsey 480 16.9 +5.5 UKIP David McDonagh 181 6.4 +6.4 BNP Michael Green 136 4.8 +4.8 Majority 282 9.9 -8.2 Turnout 2841 63.1 +31.1 Labour hold Swing
Roebuck Location of Roebuck ward Roebuck Party Candidate Votes % ±% Labour Sherma Batson 1,055 37.2 -2.5 Conservative Harvey Page 943 33.2 +0.1 Liberal Democrats Denise Baskerville 546 19.2 +7.7 UKIP Victoria Gabriel 293 10.3 -5.4 Majority 112 4.0 -2.6 Turnout 2837 62.0 +29.1 Labour hold Swing
St Nicholas Location of St Nicholas ward St Nicholas Party Candidate Votes % ±% Labour Carol Latif 1,098 41.4 -3.1 Conservative Gillian Mould 855 32.2 -1.6 Liberal Democrats Heather Snell 581 21.9 +0.2 Independent Carol Knowles 121 4.6 +4.6 Majority 243 9.2 -1.5 Turnout 2655 61.2 +29.6 Labour hold Swing
Shephall Location of Shephall ward Shephall Party Candidate Votes % ±% Labour Robert Clark 1,035 41.5 -5.9 Conservative Anita Speight 707 28.4 +2.4 Liberal Democrats Nicholas Baskerville 465 18.7 +2.5 UKIP Bob Layson 285 11.4 +1.1 Majority 328 13.1 -8.3 Turnout 2492 58.0 +26.7 Labour hold Swing
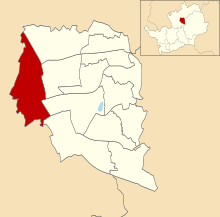
Symonds Green Location of Symonds Green ward Symonds Green Party Candidate Votes % ±% Labour Sharon Taylor 1,191 42.4 -5.2 Conservative Paul Mould 1,082 38.5 -0.4 Liberal Democrats Clive Hearmon 537 19.1 +5.5 Majority 109 3.9 -4.8 Turnout 2810 64.5 +33.2 Labour hold Swing
Woodfield Location of Woodfield ward Woodfield Party Candidate Votes % ±% Conservative Phil Bibby 1,430 52.8 -7.8 Labour Christopher Saunders 662 24.4 -1.5 Liberal Democrats Katherine Lloyd-Manning 617 22.8 +9.3 Majority 768 28.4 -6.3 Turnout 2709 67.2 +30.9 Conservative gain from UKIP Swing
Note: Woodfield ward was won by Marion Mason for the Conservatives in 2006, but she defected to UKIP in January 2008.[2]
References ^ "Election 2010". BBC News . ^ "Stevenage Conservative councillor defects to UKIP". The Comet. 29 July 2013.


 Council elections in Hertfordshire


